In my last post, I told you why I started treating autonomous driving models like LLMs—because they're both black boxes that produce confident, fluent, and occasionally fictional outputs, and neither industry has a test harness rigorous enough to catch the fiction before it reaches the real world.
This post is the how.
If you're going to trust my scorecard, you need to know exactly what the numbers mean, how I got them, and—just as importantly—what I deliberately leave out. Transparency in methodology is the only thing that separates a useful benchmark from a glorified opinion piece.
So let's open the hood. Coffee's fresh. Here's the full rig.
Latency: The Clock Starts Before You Think It Does
When most reviewers talk about "response time" in an autonomous vehicle, they mean the time between a event happening and the car reacting. That's a useful number, but it's not the number I measure.
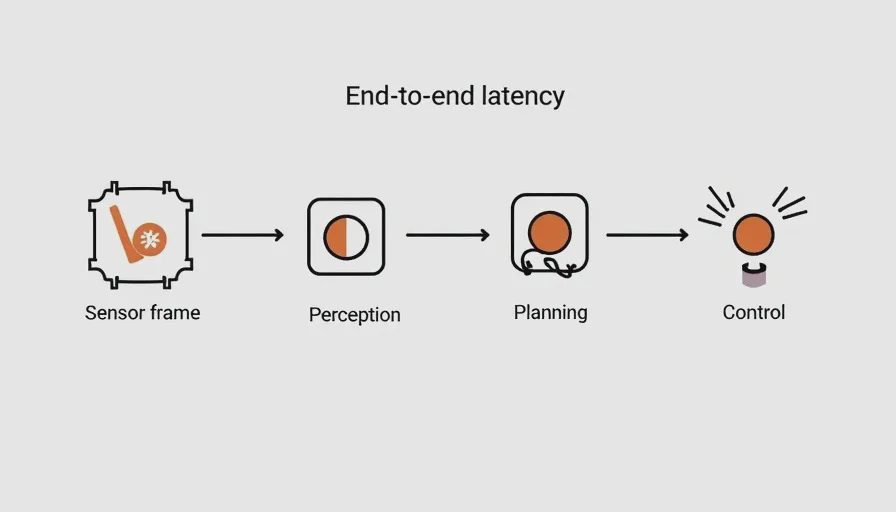
I measure end-to-end decision latency, and I define it strictly as:
The interval from the first available sensor frame containing a relevant event to the output of a new trajectory command that accounts for that event.
That's a nerdy distinction, so let me make it concrete.
Imagine a pedestrian steps off the curb. The camera captures that frame at frame 1,000. The perception pipeline takes 50 milliseconds to process it. The prediction module takes 30 milliseconds to forecast where the pedestrian is going. The planner takes 40 milliseconds to compute a new trajectory. The control module takes 20 milliseconds to translate that into steering and braking commands.
If you measure "latency" as the planner-to-control time, you get 60 milliseconds. That's a great number. It's also a lie. The full decision loop—from the pedestrian entering the frame to the wheels turning—was 140 milliseconds. And if that 140 milliseconds crosses a critical threshold, you have a collision.
I measure the full loop. I instrument my test harness to timestamp every sensor input, every intermediate output, and every final command. I average over 100 runs to smooth out jitter, and I report the 95th percentile, not the mean, because the 95th percentile is what will kill you.
The hardware: I run this on a dedicated on-board logging unit—a fanless industrial PC with a GPS-synchronized clock, pulling data from the vehicle's CAN bus, the OBD-II port, and a forward-facing camera array I mount to the windshield. Total cost: about $4,000, plus a lot of duct tape and cursing.
Hallucination: The Physical Reality Check
In LLM evaluation, a hallucination is an output that isn't grounded in the provided context or in verifiable reality. It's a statement that sounds plausible but is false.
In autonomous driving, a hallucination is similar but with a critical distinction:
A driving hallucination is a trajectory or decision that is physically impossible, logically inconsistent with the observed environment, or probabilistically implausible given the scene.
I classify hallucinations into three buckets:
Bucket A: Physical Impossibility
The model's planned trajectory violates the laws of physics. Sudden instant deceleration from 60 MPH to 0 without braking. A turn radius that would require more grip than any tire can provide. A path that passes through a solid object because the occupancy grid didn't update.
Example: Hallucination #247—the model "invented" a merge lane on a highway where the pavement markings clearly indicated a shoulder. The trajectory curved into a concrete barrier at 65 MPH. The car didn't take the trajectory (the safety monitor caught it), but the planned path was physically unrealizable.
Bucket B: Semantic Inconsistency
The model's trajectory is physically possible but semantically wrong. It treats a stop sign as a yield. It interprets a red light as a flashing yellow. It sees a construction zone with flaggers and decides the flagger is a pedestrian standing still.
Example: Hallucination #189—low-light pedestrian detection. The model correctly classified a pedestrian at 200 meters in daylight. At dusk, at 80 meters, it downgraded them to "static object" and didn't adjust trajectory. Semantic misclassification leading to a safety gap.
Bucket C: Probabilistic Outlier
The model chooses a trajectory that is physically possible and semantically plausible but so statistically unlikely given the scene that it represents a failure of the underlying distribution. This is the hardest bucket to catch, and it's where most "weird" behaviors live.
Example: On a straight, empty highway, the model swerves 18 inches toward the shoulder for no reason. It doesn't cross the line. It doesn't hit anything. But no human driver would do it. It's a 3-sigma event in the trajectory distribution—and 3-sigma events happen thousands of times a day across a fleet.
Severity Scale (1–5):
1: Minor wobble or over-correction. No safety risk, just annoying.
2: Noticeable deviation from expected behavior. Human would correct it. Minor comfort issue.
3: Clear safety-adjacent behavior. The car does something that, if repeated or prolonged, would create risk. Phantom braking at medium speed (30-45 MPH).
4: Significant safety violation. Phantom braking at highway speed (65+ MPH). Running a red light in simulation. Near-miss with a static object.
5: Critical failure. Trajectory that would have caused a collision if the safety monitor hadn't intervened. Complete semantic breakdown—e.g., driving toward a barrier, treating a pedestrian as a shadow.
I don't grade severity by outcome. I grade by potential outcome and how far the trajectory deviated from the safe envelope. If you only grade accidents, you're doing postmortem safety. I want pre-mortem detection.
Trajectory Reasonableness: The Scoring Rubric

This is the metric I'm proudest of, and the one that took the longest to design.
Trajectory reasonableness is a composite score that answers one question: Does this trajectory look like something a competent, cautious human driver would produce?
I break it down into five sub-metrics, each scored 0–100:
1. Curvature Continuity (30% weight)
A good trajectory has smooth curves. The rate of change of curvature (jerk) should be bounded. Hard transitions—abrupt lane changes, jerky steering corrections—get penalized. I compute the second derivative of the path's curvature and compare it to human driving data collected from my Miata ND on the same roads.
2. Safety Margin (25% weight)
How close does the trajectory come to other objects, lane boundaries, and road edges? I compute the minimum distance to any obstacle at each timestep. Less than 0.5 meters gets a zero. Between 0.5 and 1.5 meters gets a sliding score. More than 1.5 meters gets full marks.
3. Action-Outcome Consistency (20% weight)
Does the trajectory match the observed actions of other vehicles? If the car ahead brakes, does this trajectory brake too? If the traffic light turns yellow, does it decelerate reasonably or accelerate aggressively? I compare the trajectory against a simple "baseline driver" model—a time-to-collision-based reactive controller—and penalize deviations larger than 2 standard deviations.
4. Human Likeness (15% weight)
This is the fuzziest metric, and I'm transparent about its limitations. I use a small classifier trained on human driving data from open datasets (the Waymo Open Motion Dataset, mostly) to estimate the probability that a trajectory was generated by a human. I don't treat this as ground truth—just a sanity check. If a trajectory scores 100 on safety margin but 10 on human likeness, something is off.
5. Responsiveness (10% weight)
How quickly does the model react to new information? If a pedestrian steps off the curb, how many frames before the trajectory updates? This is a lightweight version of the latency metric, included to capture decision agility in dynamic scenes.
Final Score: Weighted average, 0–100. 90+ is "trust it with my family." 70–90 is "fine but needs oversight." Below 70 is "do not deploy."
Long-Tail Scenario Taxonomy
The hardest part of autonomous driving isn't the 99.9% of miles that are straight highways and clear weather. It's the 0.1%—the long tail of edge cases that a model has never seen before.
I test six categories of long-tail scenarios, each with a minimum of 50 variants:
1. Adverse Weather & Lighting
Heavy rain (different intensities)
Snow/slush (Michigan winters are great for this)
Glare from low sun (sunset/sunrise, directly at camera)
Night with minimal ambient lighting
Fog (varying densities)
2. Infrastructure Degradation
Worn lane markings (faded, cracked, missing)
Temporary construction zones (cones, barrels, shifted lanes)
Unpaved or gravel shoulders
Irregular intersections (5-way intersections, traffic circles, split lanes)
3. Agent Behavior Extremes
Unpredictable pedestrians (children, erratic walkers, jaywalkers)
Cyclists in traffic (swerving, signaling, merging)
Emergency vehicles (lights, sirens, unexpected stops)
Aggressive cut-ins (other vehicles merging at the last second)
4. Traffic Control Failures
Malfunctioning traffic lights (flashing red, flashing yellow, completely dark)
Missing or obscured signs (covered by vegetation, knocked over)
Temporary signs (construction, detour, event parking)
5. Map/Odometer Discrepancies
GPS drift (urban canyons, tunnels)
Map out-of-date (new turn lanes, closed roads)
HD map misalignment (lane geometry doesn't match reality)
6. "Weird" Scenarios
Animals on the road (deer, dogs, turkeys—yes, turkeys)
Debris (fallen branches, mattress on highway, tire treads)
Unusual vehicle configurations (oversized loads, farm equipment, trailers)
I run my test harness through these scenarios in simulation first (using a custom CARLA-based environment I built), then validate the top-failing cases on real roads with safety drivers. Every hallucination in the log is tagged with the scenario category that triggered it.
What I Ignore (Deliberately)
A methodology is defined as much by what it excludes as what it includes.
I don't measure ride comfort. Not directly. I measure jerk, curvature continuity, and safety margin—all of which correlate with comfort—but I don't have a "smoothness" slider. Comfort is subjective. My daughter Maya will tell you if the car rides "like a robot," but I'm not putting that in a spreadsheet.
I don't measure HMI quality. I don't care if the screen is responsive, if the visualization is pretty, or if the voice prompts are clear. That's hardware and UX. It matters to customers, but it doesn't matter to safety. I left that to Alex at screendriven.com.
I don't measure disengagement rate. It's a backward-looking metric that tells you about human intervention, not model competence. I've written a whole post on why I think it's essentially useless as a safety benchmark. (Coming soon in the Scorecard.)
I don't measure "features" in the marketing sense. I don't care about "city streets" vs. "highway" branding. I test the car's ability to handle the subtask—lane keeping, intersection negotiation, pedestrian detection—regardless of what the OEM calls it.
I don't test systems I haven't personally run through my harness. I don't write about press releases. I don't summarize YouTube videos. If I haven't put it on my rig and collected data, it doesn't go on the site. Period.