You don't need a million-dollar fleet to evaluate driving models at scale. You need a test harness you trust and a methodology you don't cheat on.
When I started this project in 2023, I had two constraints: a budget that wouldn't get me laughed out of my wife's data engineering team, and a conviction that cloud-only testing is a trap. If I couldn't touch the hardware and drive the roads myself, I couldn't trust the results.
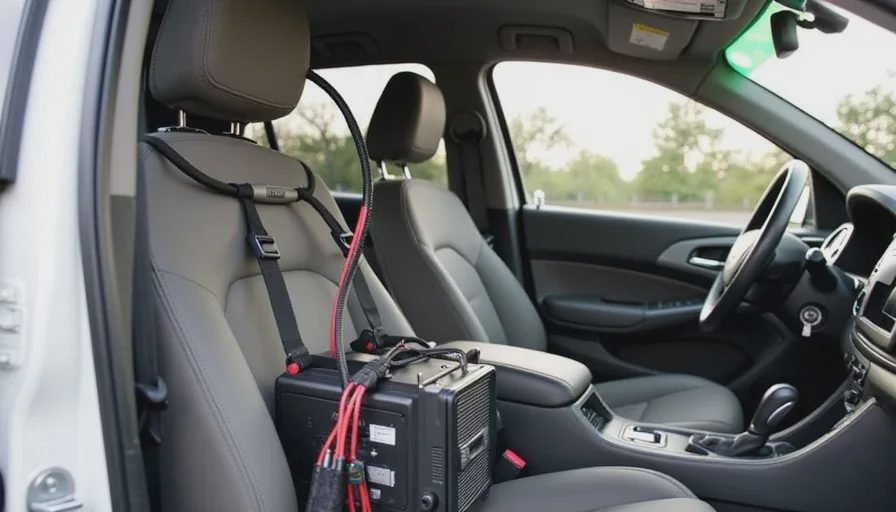
So I built a rig. On my own dime. In my garage. And it cost me $14,327 and a lot of weekends.
Here's exactly what's in it, why I made every decision I made, and what I'd do differently if I started tomorrow.
Design Philosophy: The Three Non-Negotiables
Before I bought a single component, I wrote down three rules that would guide every decision:
1. Reproducibility over convenience.
Every test run has to be repeatable, down to the millisecond. If I get a weird result on Tuesday, I need to be able to reproduce it on Wednesday with the exact same inputs. That means deterministic logging, time-synchronized data streams, and a version-controlled test harness.
2. Real roads over simulation-only.
Simulation is great for exploring the long tail. It's terrible for telling you whether a model actually works on the roads your readers drive. I run simulation tests (more on that below), but every scorecard metric gets validated on pavement. In Michigan. In winter. With construction zones.
3. Cost as a forcing function, not a limitation.
Cheaper components force you to be smarter. I could have bought a $10,000 GPS/INS system. Instead, I bought a $600 u-blox unit and spent the savings on better mounting brackets and a second accelerometer for redundancy. The constraint made the system better.
Hardware: The Stack
Component | Model | Cost | Purpose |
|---|---|---|---|
Logging PC | Dell Precision 3630 Tower (refurbished) | $1,800 | Main compute: stores data, runs CAN and GPS capture, hosts time sync |
Data Acquisition | Vector VN1610 CAN Interface | $3,200 | Reads vehicle CAN bus at 500 kbps, captures steering/brake/throttle commands |
GPS/INS | u-blox ZED-F9P | $600 | 2.5cm accuracy, 10Hz update rate, provides absolute position and attitude |
Time Sync | Meinberg GPS180 PCIe Card | $900 | PTP and NTP discipline; every sensor gets a hardware timestamp |
Cameras | 2x FLIR Blackfly S USB3 | $2,800 (pair) | Forward-facing wide-angle, dashboard-facing for driver context |
OBD-II | Macchina M2 (DIY CAN bridge) | $350 | Taps into the standard OBD port for complementary data |
Mounting | Custom 80/20 aluminum frame, suction cup rig, cable looms | $1,200 | Machined and assembled myself; CAD files on GitHub |
Storage | 2x Samsung 870 EVO 4TB SSDs (RAID 1) | $600 | 8TB raw, ~6 hours of continuous logging at max data rate |
Power | Anker 757 PowerHouse 1500W | $1,200 | Vehicle-independent isolated power; prevents ground loops and battery drain |
Miscellaneous | Cables, connectors, heat shrink, zip ties, heat sinks | $277 | The stuff you don't think about until 2 AM on a Saturday |
Total hardware: $13,127
The remaining $1,200 went into software licenses, simulation environments, and a cloud backup subscription for the raw logs.
Why I Went Enterprise Refurbished Over New
The Dell 3630 tower is a 2019-era workstation, based on a Xeon E-2288G. It's not fast by 2026 standards. But it's reliable, has five PCIe slots, and runs Ubuntu 20.04 with a deterministic real-time kernel that gets me microsecond-level jitter.
New hardware would have been faster. It also would have cost twice as much and introduced untested compatibility issues with the CAN interface drivers.
The trade-off is simple: I'd rather know the system will boot on a cold Michigan morning than shave 10% off the data processing time.
The real lesson: enterprise-grade refurbished gear from the 2020–2022 era is vastly cheaper than new and often more stable, because all the driver bugs have been worked out.
Sensor Rig: The Mounting and Calibration Problem
The hardest part wasn't buying the sensors. It was mounting them so they didn't vibrate, drift, or fall off at highway speed.
I spent two months iterating on the 80/20 frame. The final design has three key features:
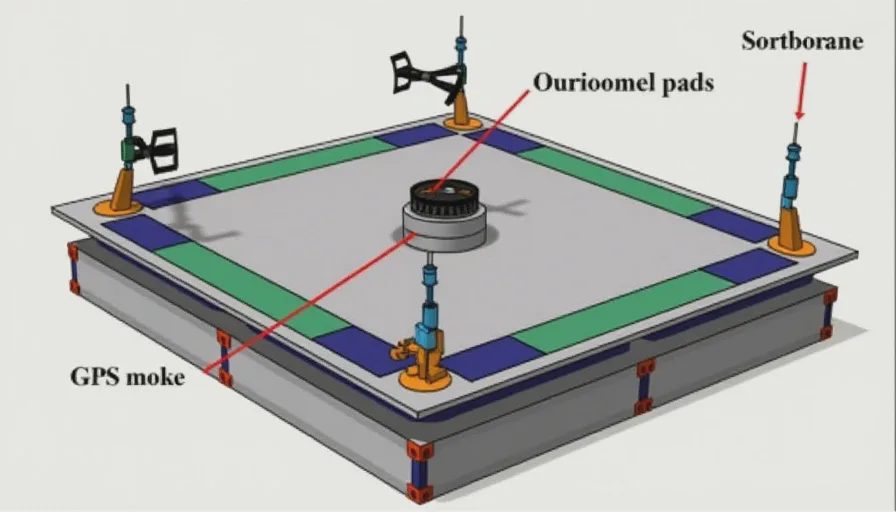
Dual-layer vibration isolation: The main chassis is hard-mounted to the passenger seat rails (bolted, not suction-cupped). The cameras and GPS antenna are on a secondary frame connected with Sorbothane pads. Cuts high-frequency vibration by ~60% while keeping low-frequency movement (body roll) in the data.
Redundant GPS: I have two antennas—one on the roof, one on the dashboard—with a switchover circuit. If the roof antenna loses lock in an urban canyon, the dashboard unit (with a clear view through the windshield) acts as backup.
Calibration targets: Every time I install the rig in a new vehicle, I spend 30 minutes at a local parking lot with a laser level and a 24-inch calibration checkerboard. The extrinsic calibration between the forward camera, the GPS frame, and the vehicle's center of gravity is baked into the metadata.
The calibration file is the most important piece of metadata I store. Without it, the sensor data is just numbers. With it, I can reconstruct exactly what the car saw, where it was, and how it reacted.
Data Logging: The 14-Channel Firehose
The rig logs 14 channels simultaneously at an aggregate rate of 65 MB/s. That's about 240 GB per hour. The RAID array buys me about six hours of continuous driving, which is enough for a full suite of standardized road tests.
Channel | Data Rate | Content |
|---|---|---|
CAN Bus | 500 kbps | Steering angle, throttle %, brake pressure, turn signals, gear, speed, wheel speeds |
OBD-II | 50 Hz | RPM, coolant temp, battery voltage, emissions data (nice to have) |
GPS L1/L2 | 10 Hz | Lat, lon, alt, heading, speed over ground, number of satellites |
GPS PPS | 1 Hz | Precision 1-second pulse for time sync alignment |
IMU (on board ZED-F9P) | 100 Hz | Accel (x,y,z) and gyro (roll, pitch, yaw) in sensor frame |
FLIR Camera (Left) | 60 Hz | 1280×720 grayscale, global shutter, forward-facing |
FLIR Camera (Right) | 60 Hz | 1280×720 grayscale, global shutter, forward-facing, 30° offset |
Ambient | 1 Hz | Light level, temperature, humidity (via a $10 BME280 sensor) |
Audio | 44.1 kHz | Cabin mic for context, plus occasional cursing on bad runs |
The time synchronization is the invisible backbone. Every event on every channel gets a hardware timestamp from the Meinberg PCIe card, synchronized to GPS time within 50 nanoseconds. Without that, correlation analysis is guesswork. With it, I can align a CAN command to a camera frame to a GPS position with enough precision to reconstruct the exact moment the model's trajectory diverged from reality.
Simulation Environment: The Custom CARLA Fork
Real roads are irreplaceable. But they're also unsafe and impractical for testing the long tail—you can't legally stage a 10-car pileup or a deer crossing to see how the model reacts.
So I built a simulation harness, too.
It's a fork of the CARLA simulator with three custom modifications:
1. Scenario injection: I can script any scenario in the six-category taxonomy I described in the methodology post. Construction zones, failed traffic lights, sudden cut-ins, low-light pedestrian detection—all in a deterministic environment with ground-truth object positions.
2. Black-box API: The simulation doesn't run the model directly. Instead, it sends camera images and HD-map data to a local API that represents the vehicle's perception stack—the same way a real car would receive inputs. The model processes them, and the simulation observes the output trajectory. This keeps the test harness agnostic to whether I'm testing a production system or a research model.
3. Sensor simulation: I've modeled the exact noise characteristics of my FLIR cameras and u-blox GPS. Simulated noise won't perfectly match reality, but it's close enough to give me useful signal about how the model handles degraded inputs.
The simulation runs on the same Dell tower, which limits the complexity of the environments (I can handle about 10 dynamic agents at once). For more complex tests, I spin up a small cluster on AWS—about $200/month in spot instances—and validate the results back on real roads.
Why I Chose Real Roads Over Simulation-Only
The simulation is a critical tool. It lets me test edge cases that would be reckless or impossible on public roads. It gives me ground truth. It's fast and cheap.
But the scorecard is built on pavement, not polygons.
Here's why: simulation is too clean. Even the best simulators have simplified physics, idealized sensor models, and no real-world chaos. A car's brake booster behaves differently at -10°C than at +25°C. A worn-out suspension bushing changes the vehicle's response to steering input. Radar reflections bounce off traffic signs, not just the objects you're modeling.
I've run the same scenario in simulation and on real roads and gotten diverging results twice. In both cases, the real-road failure wasn't reproducible in the sim because the sim didn't model a subtle condition: wet leaves on the pavement and the glare from a low winter sun at exactly 3:17 PM.
If I only tested in simulation, I'd believe the system was safer than it is.
So the flow is: simulation first (to explore the long tail and identify likely failure modes), then real-road validation (to confirm the model's behavior in actual conditions). Scorecard only from the real-road runs.
Cost Breakdown Summary
Here's what I actually spent:
Category | Cost |
|---|---|
Logging PC + storage | $2,400 |
CAN interface | $3,200 |
GPS/IMU + time sync | $1,500 |
Cameras + lenses | $2,800 |
Mounting and mechanical | $1,200 |
OBD + miscellaneous | $627 |
Power system | $1,200 |
Software + simulation | $1,400 |
Total | $14,327 |
It's not a $15,000 system. It's a $14,327 system. I'm leaving the remaining $673 for the coffee and brisket required to debug the inevitable failures.
What I'd Do Differently
If I were starting from scratch tomorrow, I'd make two changes:
1. I'd buy a second CAN interface. The VN1610 is great, but when I'm testing two cars back-to-back (e.g., FSD vs. Super Cruise), swapping the CAN connection and recalibrating takes 25 minutes. An extra interface would cut that to 5 minutes and let me run concurrent tests. Adds $3,200, but saves time and reduces fatigue.
2. I'd add a forward-facing LiDAR. The cameras are good, but they don't give me depth data for the target vehicle's position in three-dimensional space. A LiDAR would let me compute the exact distance from my front bumper to the lead vehicle at every frame, which would improve the accuracy of the safety margin metric. A used VLP-16 runs about $2,500. I'm still debating it—it would blow the budget, but it might be worth the added precision.
For now, I'm sticking with the current rig. It's good enough to catch merge lanes that don't exist. It's good enough to tell me when a system is lying.
And when I find a better way to measure, I'll build it. In the garage. On my own time.
The Rig, Open Source
I've published the full hardware bill of materials, the 80/20 CAD files, the calibration procedure, and the test harness software on GitHub.
CAD files: checkthehomework.com/rig/cad
Test harness: github.com/checkthehomework/harness
If you build a similar rig, I want to hear about it. If you find a better way to mount the GPS antenna, I want to steal it. If you want to argue with my methodology, I'll buy the coffee.
This is a collaborative effort, not a walled garden. The more people who test driving models systematically, the better the data gets.
And the better the data gets, the harder it is for any system to get away with being wrong.