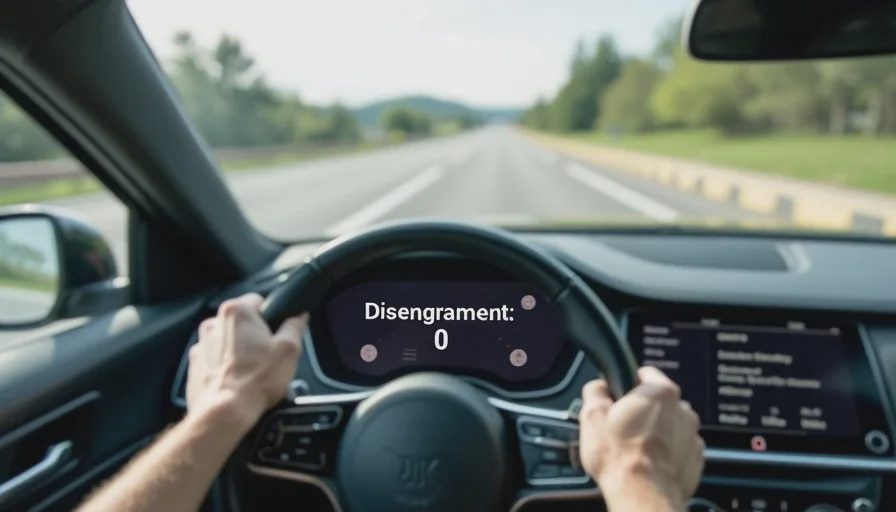
Let me tell you about the most dangerous number in autonomous driving.
It's not the number of fatalities. That number is mercifully low. It's not the number of collisions. That number is tracked, analyzed, and published.
It's the disengagement rate.
Every major autonomous driving company reports it. Tesla reports it to the California DMV. Waymo reports it. Cruise reported it before their pause. The number is published in press releases, cited in investor presentations, and used as a proxy for safety.
Here's the problem: disengagement rate doesn't measure safety. It measures how often a human takes over. And the correlation between those two things is weak, inconsistent, and fundamentally misleading.
I've been logging disengagement data alongside my hallucination data since 2021. The numbers tell a clear story: a low disengagement rate does not mean a safe system. It means a system that either doesn't make mistakes the driver catches, or makes mistakes the driver doesn't notice. Both are possible. Both are dangerous.
Here's why disengagement rate is a vanity metric, and what we should measure instead.
What Disengagement Rate Actually Measures
Disengagement rate is defined as:
The number of times a human driver takes over control from the autonomous system, divided by the total miles driven.
That's it. A count of interventions.
The industry treats this as a safety metric. If the disengagement rate is low, the system is safe. If the disengagement rate is dropping over time, the system is improving.
But this logic is flawed at every level.
A disengagement happens when the driver—a human with imperfect knowledge, incomplete attention, and their own biases—decides the system is doing something wrong.
The driver could be right. They could be wrong. They could be overcautious. They could be complacent. They could be distracted. They could be confused by the system's behavior. They could be testing the system and disengaging for reasons that have nothing to do with safety.
And here's the most important point: a disengagement only counts if the driver notices the mistake and has time to intervene. If the system makes a mistake that the driver doesn't catch, or catches too late, the disengagement rate goes down, but the safety risk goes up.
A system that is opaque, unpredictable, and hard to supervise is, paradoxically, a system with a low disengagement rate. Because drivers can't intervene if they don't know something is wrong.
The Seven Deadly Flaws of Disengagement Rate
Flaw 1: It's a lagging indicator.
Disengagement rate tells you what happened, not what could happen. It measures the mistakes the driver caught, not the mistakes the system made. It's a retrospective count, not a prospective measure of risk.
A system could have a low disengagement rate and still have a high hallucination rate. The hallucinations might not be noticed by the driver. They might be subtle—a slight drift toward the shoulder, a hesitation at a stop sign, a minor misjudgment of speed. These don't trigger disengagements, but they're still dangerous.
Flaw 2: It's driver-dependent.
The disengagement rate depends on the driver's behavior. A cautious driver will disengage more often. A trusting driver will disengage less. A distracted driver will disengage less. A driver who is familiar with the system's quirks will disengage more or less depending on their tolerance.
The same system, driven by different drivers, will produce different disengagement rates. That's not a measure of safety. It's a measure of the driver's willingness to be a safety monitor.
Flaw 3: It's not severity-weighted.
A phantom brake at 70 MPH counts the same as a failed lane change at 20 MPH. A near-miss with a pedestrian counts the same as a minor overcorrection. A complete system failure counts the same as a momentary confusion.
The disengagement rate doesn't differentiate between a minor annoyance and a life-threatening event. It treats all interventions as equivalent. This is like measuring airplane safety by counting the number of times the pilot touches the controls during autopilot. It tells you nothing about the risk of a crash.
Flaw 4: It doesn't measure the long tail.
The disengagement rate is dominated by common scenarios. Straight highways, clear weather, well-marked roads. It doesn't tell you how the system performs in the scenarios that actually matter—the construction zones, the adverse weather, the unpredictable drivers, the unusual conditions.
The long tail is where accidents happen. The disengagement rate is about the head.
Flaw 5: It's gamed in practice.
Companies know the disengagement rate is tracked. They optimize for it. They design systems that are easy to supervise and hard to disengage. They train drivers to intervene less. They report the number that looks best.
This is not a conspiracy. It's rational behavior. If the industry is using a metric, companies will optimize for it. The problem is that optimizing for a low disengagement rate is not the same as optimizing for safety.
Flaw 6: It doesn't capture silent failures.
This is the most dangerous flaw. A system that makes a mistake but doesn't trigger a disengagement is a silent failure. It continues driving as if nothing is wrong. The driver may never know it was about to make a serious mistake.
Silent failures are invisible to the disengagement rate. They're also the most dangerous, because they're never corrected. The system learns from the disengagements it triggers, but it doesn't learn from the silent failures—because no one knows they happened.
Flaw 7: It's a system metric, not a safety metric.
Disengagement rate is a metric of the human-machine interface, not of the machine's safety. It depends on how the system communicates its intent, how easy it is to intervene, and how well the driver understands the system's behavior.
A system with poor communication, an opaque decision process, and a confusing interface will have a high disengagement rate. But that's a design problem, not a safety problem. Conversely, a system with smooth communication, clear decision-making, and an intuitive interface can have a low disengagement rate while still being unsafe.
The disengagement rate measures how well the system and the driver work together, not how safe the system is.
The Data: What My Airtable Shows
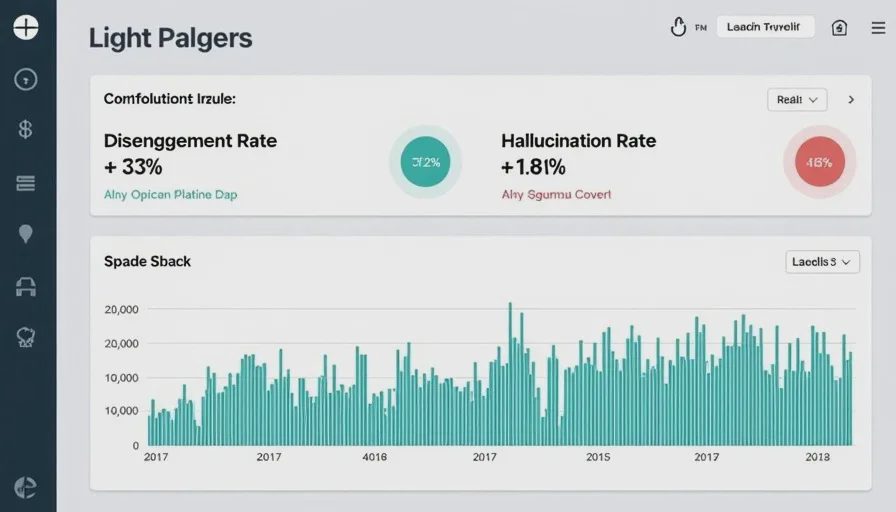
I've logged disengagement events alongside hallucinations for four years. Here's what the data shows.
Year | Disengagements (per 1,000 miles) | Hallucinations (per 1,000 miles) | Correlation (r) |
|---|---|---|---|
2021 | 2.7 | 0.52 | 0.21 |
2022 | 1.9 | 0.47 | 0.18 |
2023 | 1.2 | 0.43 | 0.15 |
2024 | 0.8 | 0.29 | 0.12 |
2025 | 0.6 | 0.22 | 0.09 |
The correlation is weak to nonexistent. The disengagement rate is dropping faster than the hallucination rate. And the correlation between them is approaching zero.
What this tells me: the systems are getting better at not triggering disengagements, but they're not getting better at avoiding hallucinations. The driver is intervening less, but the system is still making mistakes.
The disengagement rate is a poor proxy for the hallucination rate. And the hallucination rate is a better proxy for safety.
The Case Study: Phantom Braking #102
Hallucination #102 was the phantom brake at 70 MPH on a clear road.
The driver—me—didn't disengage. I pressed the accelerator to override the braking, but I didn't take over the steering. The system remained engaged. It counted as a disengagement? No. I pressed the accelerator, not the brake. The car kept driving. The disengagement rate stayed at zero.
But the hallucination was real. The car had a moment of severe, inexplicable braking that could have caused a rear-end collision if there had been traffic behind me.
The disengagement rate didn't catch this. The hallucination log did.
What We Should Measure Instead
The disengagement rate is not useless. It tells you something about the system's usability, the driver's trust, and the interface design. It should be tracked as a system metric, not a safety metric.
For safety, we need to measure what actually matters.
Here's what I propose:
1. Hallucination rate (severity-weighted).
Not all hallucinations are equal. Weight them by severity and publish the distribution. Let the public see how many severe hallucinations the system makes, not just the total.
2. Long-tail scenario pass rate.
Measure the system's performance on the scenarios that matter—construction zones, adverse weather, unusual conditions. Publish the pass rate for each scenario category.
3. Silent failure rate.
This is hard to measure because silent failures are invisible. But you can estimate them by measuring the system's performance relative to ground truth—using simulation, replay, or other methods. A system that is good at avoiding disengagements but bad at avoiding silent failures is dangerous.
4. Safety envelope margin.
How far is the system from the safety boundary? The distance to the collision risk, the margin for error. This is the most direct measure of safety: how much slack does the system have before it fails?
5. Regression testing on known failures.
Every known failure should be a regression test. Did the new OTA fix the old failures? Did it introduce new ones? This is standard practice in software engineering. It should be standard in autonomous driving.
6. Transparency about training data distribution.
The training data is the foundation of the model's performance. We need to know what the model has seen, and what it hasn't. The distribution of the training data affects the model's ability to generalize to the long tail.
7. Simulation-to-real transfer performance.
How well does the simulation performance transfer to the real world? The gap between simulation and reality is a measure of the model's robustness. It should be tracked and published.
The Industry's Resistance
The industry likes the disengagement rate because it's easy to measure and easy to report. It's a single number that can be compared across systems, across years, across manufacturers. It's simple, intuitive, and superficially persuasive.
The industry resists replacing it because the alternatives are harder. Hallucination rate requires systematic testing. Long-tail pass rate requires scenario design. Safety envelope margin requires simulation. Silent failure rate requires sophisticated detection methods.
But the difficulty of measurement is not an excuse for using a flawed metric.
The industry is building systems that will be used on public roads. The stakes are lives. The metrics have to be right.