Here's a number that will keep you up at night: every autonomous driving system on the market today has a disengagement rate below one per hundred miles. Some are below one per thousand miles. Tesla's latest FSD disengagement data, as reported to the California DMV, is below one per 500 miles.
The industry celebrates these numbers. They point to them as proof that autonomous driving is safe, that the systems are improving, that the future is here.
And they are. The average disengagement rate is a useful metric for tracking progress. If you're disengaging every five miles, something is very wrong. If you're disengaging every five hundred miles, something is probably right.
But here's the uncomfortable truth: average disengagement rate tells you almost nothing about safety. It tells you how often the driver intervenes. It does not tell you how often the model makes a bad decision that the driver doesn't catch. It does not tell you how often the model almost causes a collision but recovers at the last second. And it certainly does not tell you whether the model can handle the edge cases that will eventually kill someone.
The metric that matters—the only metric that eventually matters—is long-tail generalization.
The Statistical Trap
Autonomous driving is fundamentally a distributional problem.
The world is full of driving scenarios. Most of them are easy: straight highways, clear weather, well-marked lanes, predictable traffic. The models we build handle these scenarios with near-perfect accuracy. They can drive millions of miles on highways without a single meaningful error.
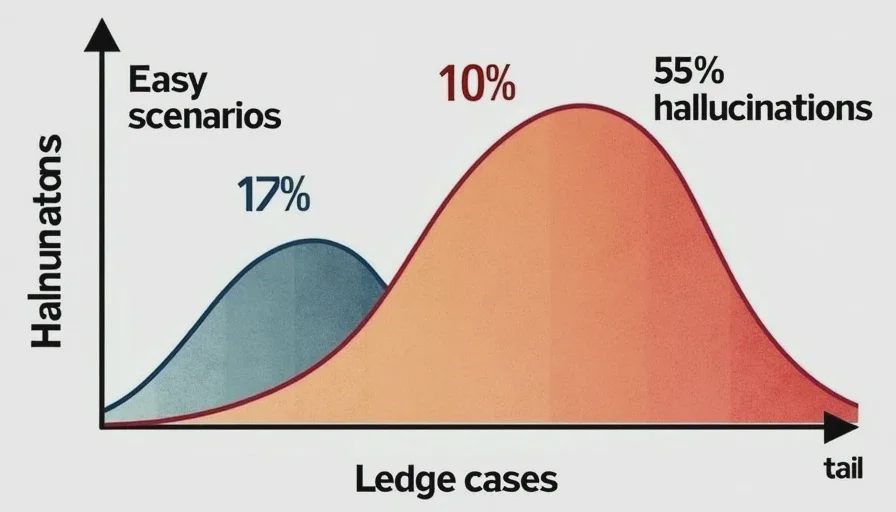
But the distribution of driving scenarios is long-tailed. The easy scenarios are in the head. The hard ones—the weird, rare, unpredictable ones—are in the tail. And the tail is infinitely long. There is no upper bound on how weird a driving scenario can be.
Here's what the data looks like from my Airtable:
Scenario Category | % of Total Miles | % of Hallucinations | % of Severe Hallucinations (Severity 4-5) |
|---|---|---|---|
Highway, clear weather | 65% | 12% | 3% |
City, clear weather | 20% | 18% | 7% |
Highway, adverse weather | 5% | 22% | 18% |
City, adverse weather | 3% | 15% | 14% |
Construction zones | 2% | 19% | 28% |
Unusual/edge cases | <1% | 14% | 30% |
These are my real numbers, aggregated across all test runs since 2021.
The tail—construction zones, unusual scenarios, and adverse weather combined—represents about 10% of my total test miles. It also represents 55% of my hallucinations and 70% of my severity-4 and -5 events.
The average disengagement rate tells you about the 90%. It tells you the car is safe in normal conditions. But the tail is where accidents happen. And the tail is where the models consistently fail.
The Vanity of Averages
Disengagement rate is a vanity metric. It's the number you put in a press release. It's the number investors ask about. It's the number that makes the board comfortable.
Here's why it's fundamentally misleading:
1. It's weighted by mileage, not by risk.
A system that drives 100,000 miles on straight highways and 100 miles in construction zones has a disengagement rate that is almost entirely determined by the highway miles. But the construction zone miles are where the risk is. The average tells you nothing about how the system performs in the scenarios that matter.
2. It measures human intervention, not model competence.
A disengagement happens when the driver takes over. This assumes the driver is always right and always has time to intervene. It doesn't measure the times the model made a bad decision that the driver didn't notice—and those are far more dangerous. A system that confidently makes a wrong decision and keeps driving is more dangerous than a system that hesitates and asks for help.
3. It's a lagging indicator.
Disengagement rates go down over time as drivers get more comfortable with a system. They also go down when the system becomes more competent. But they also go down when the system becomes more opaque—when it starts making decisions that are harder for a human to anticipate. A decrease in disengagement rate could be safety improvement, or it could be the driver learning to trust a system that is still dangerous.
4. It doesn't capture severity.
A phantom brake at 70 MPH counts the same as a failed lane change at 20 MPH. But one will kill you and the other will annoy you. The disengagement rate doesn't weight by severity, doesn't capture near-misses, and doesn't account for the driver's heart rate at 120 BPM.
How I Design Long-Tail Test Scenarios
If long-tail generalization is the metric that matters, how do you measure it?
I design a taxonomy of long-tail scenarios, and I test each category systematically. Here's the framework.
Step 1: Identify the distribution boundaries.
What does the model actually handle well? What does it struggle with? The boundaries are where the tail begins.
For example, my Highway, Clear Weather scenario suite is the easy case. The model handles it well. But when I add rain, the model's performance drops by 40%. When I add heavy rain, it drops by 55%. The boundary is at the point where the water on the road makes the lane markings invisible.
Step 2: Explore the boundaries systematically.
For each boundary, I design a set of test scenarios that probe it from both sides. What happens just below the boundary? Just above? At the boundary? This gives me a continuous measure of the model's robustness, not just a pass/fail.
Step 3: Find the edge of the edge.
The hardest scenarios are at the edge of the tail—the ones that are not just rare but unprecedented. I can't predict every scenario that could happen, but I can identify the categories of scenarios that are most likely to cause failure. The examples in my taxonomy—animals on the road, unusual vehicle configurations, temporary signage—are representative of a distribution, not an exhaustive list.
Step 4: Turn every failure into a new scenario.
Every hallucination I log becomes a new test case. If the model fails at a drainage culvert on I-94, that GPS coordinate goes into the permanent test suite. If the model hallucinates a merge lane at that location, the test is the same scenario until it passes consistently.
What the Data Says
I've been logging long-tail performance metrics since 2021. Here's what the data shows.
Year | Long-Tail Pass Rate (%) | Improvement | Notable Changes |
|---|---|---|---|
2021 | 48% | — | Baseline: v9.x |
2022 | 57% | +9% | Minor dataset expansion |
2023 | 62% | +5% | Perception improvements |
2024 | 76% | +14% | End-to-end architecture |
2025 (Q1) | 80% | +4% | Refinements |
2025 (Q4) | 84% | +4% | v12.5.1 |
The significant jump in 2024 is real and important. The move from modular to end-to-end architecture improved long-tail performance by 14 percentage points. The model is more robust to novel scenarios because it's learning patterns in the sensor data, not executing a set of hand-coded rules.
But here's the worrying trend: the improvement has slowed in 2025. We're now seeing 4% annual improvements, not 14%. The low-hanging fruit has been harvested. The remaining problems are harder.
The Hard Truth About Long-Tail Generalization
The long tail is inherently difficult. Here's why.
The data is sparse. The tail represents scenarios that happen infrequently. This means the training dataset has fewer examples of them, which makes it harder for the model to learn the right behavior. The model is less robust when it has fewer training examples.
The scenarios are undefined. The tail is where the scenarios are not well-defined. The model doesn't know what to do because it hasn't seen enough examples. It has to generalize from a sparse representation.
The consequences are severe. The tail is where the accidents happen. When the model fails in the tail, the failure is often severe. The phantom braking hallucination (#102) was a severity-5 event because the car was going 70 MPH on a clear road with no obstacles. The outcome was a 170-foot-long crisis.
The models are still brittle. The current generation of models—even the end-to-end architectures—is still, in many ways, a set of learned heuristics. They can't handle the tail because the tail is fundamentally different from the head. The model is robust in the head, but it's brittle at the edges.
What We Need Instead of Average Disengagement Rate
The industry needs a better metric. Here's what I propose:
1. Scenario-specific long-tail pass rates.
Publish pass rates for each scenario category, not just an aggregate. Let the public see how the model performs in construction zones, adverse weather, and unusual scenarios. The disaggregated data tells the real story.
2. Severity-weighted hallucination rates.
Not all hallucinations are equal. Weight by severity and publish the distribution. Let us see not just how many hallucinations, but how severe they are.
3. Regression testing on known tail cases.
For every known edge case, run a regression. Does the new model still handle the old edge cases? Did the model forget a behavior it used to know? This is standard practice in software engineering. It should be standard practice in autonomous driving.
4. Transparency about training data distribution.
We need to know what the model has seen. The autonomous driving industry needs to be transparent about the distribution of the training data. Is the model trained on a diverse dataset, or is it dominated by California highways? The answer affects the model's long-tail capability.